Resonator Banks
In my last post, I wrote: “the really exciting fun starts from something like this: a bank of oscillators tuned at a range of frequencies, that resonate in real-time with the input signal from the microphone, and possibly interact with each other.” Exciting fun might very well be around the corner, as resonator banks are part of the latest version of the Oscillators package and version 2.0 of the Oscillators app, now available for download on the Apple App Store, showcases their use for live audio signal frequency analysis.
In this post I outline my resonator bank designs, and some basic analysis applications showcased in the app.
Resonator banks
For now, a resonator bank is just a set of resonators that receive the same input signal which dictates their individual amplitudes independently. The resonators can be tuned to different frequencies and/or have different dynamic properties.
I have experimented with several designs and implementations.
The package offers a resonator bank where all the resonators are modeled in single manually managed array (Swift only) so that per sample update operations consist in single calls to the Accelerate framework for the whole bank of oscillators. This seems actually quite efficient up to a certain size, as Accelerate operations are parallelized, but efficiency drops when the array exceeds a certain size (likely dictated by memory). Furthermore, this design does not allow leveraging concurrency.
For independent resonators, audio samples must be processed sequentially and in order, but updates can be applied concurrently across resonators. Therefore, an array of individual resonators (which leverage the Accelerate framework) seems to offer the best opportunity to leverage concurrency and therefore afford better scalability. The package features Swift and C++ implementations, for direct performance comparison. Furthermore, resonator banks offer three update functions:
- Sequential: calls the update function for each resonator sequentially
- Concurrent: calls update for each resonator concurrently, with update calls grouped in a fixed number of concurrent tasks
- Gradient Frequency heuristic: groups update calls from both ends of the bank, which should work well for Gradient Frequency banks as this should results in tasks of similar complexity (in a Gradient Frequency bank, the resonators are tuned to natural frequencies based on human auditory perception and organized from lowest to highest frequency, and the amount of computation required per update is higher for lower frequencies)
Proper evaluation of these would require more thorough and systematic study across various architectures, for which I don’t have time or resources at the moment. By default the Oscillators app uses the C++ implementation and the Concurrent update function (if the device supports more than 2 concurrent threads). The implementation and update function can be changed on the Settings Screens - see User Guide.
Frequency Analysis
For frequency analysis, the resonators in the bank are tuned to natural frequencies based on human auditory perception and organized from lowest to highest frequency (Gradient Frequency bank). Such a bank arguably captures relevant frequency information about the input signal, while affording flexibility on resonator frequency range and distribution. The app showcases frequency analysis in an instantaneous plot of live signal analysis, and a spectrogram plot.
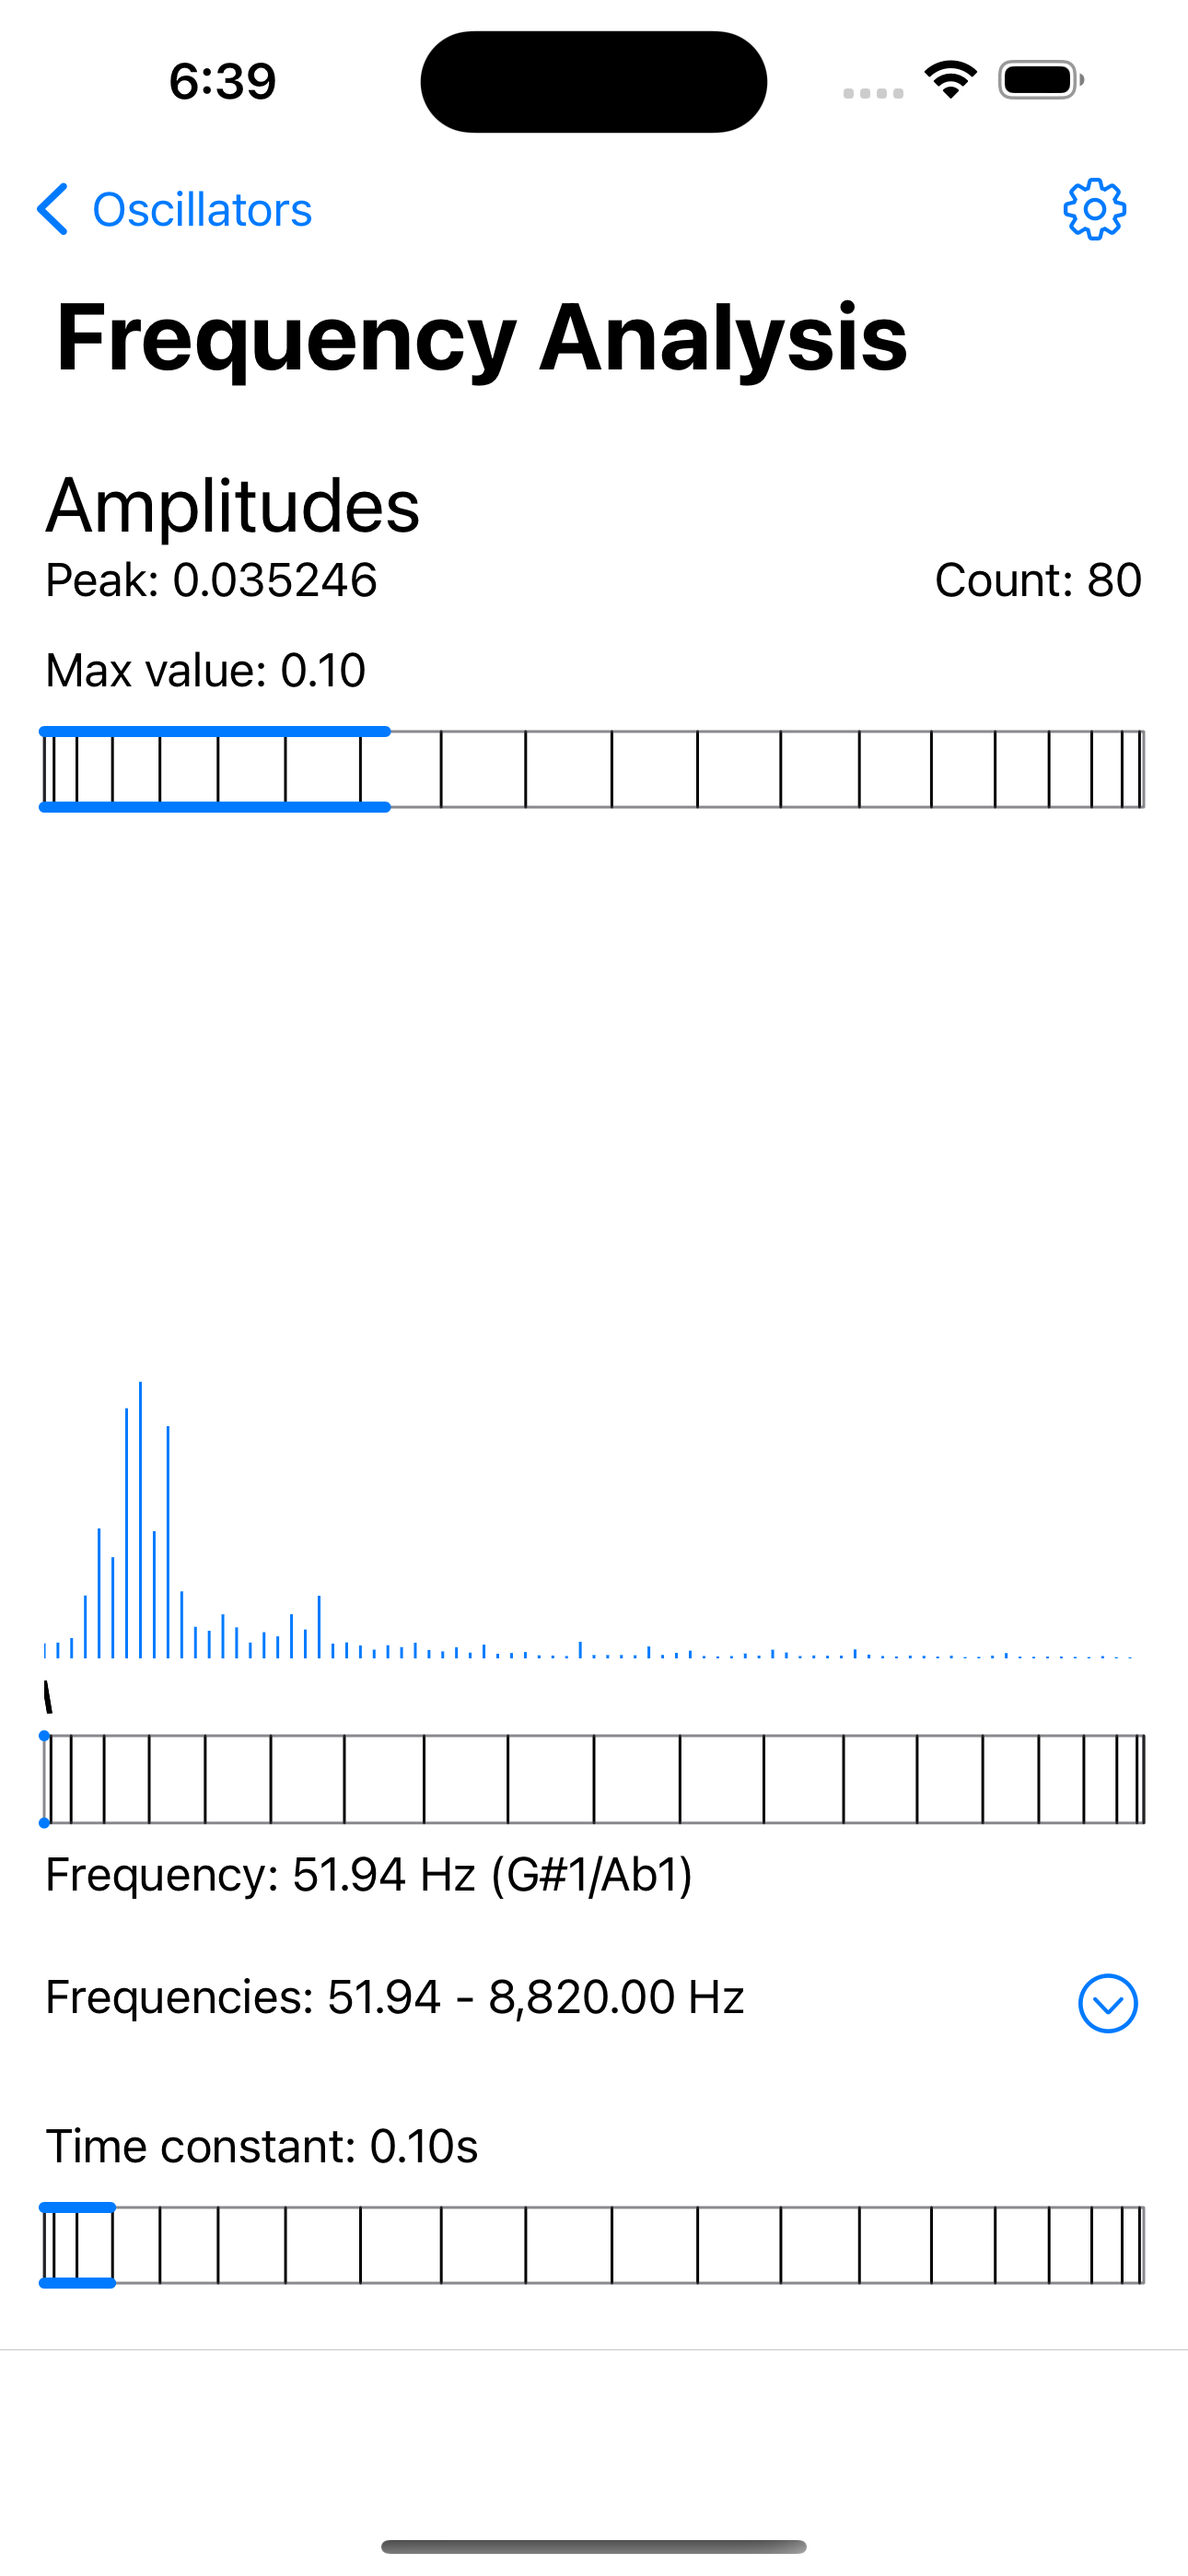
Instantaneous Plot: the amplitude graph plots the current amplitude of each resonator in the bank. The resonators are ordered by increasing frequency from left to right on the horizontal axis.
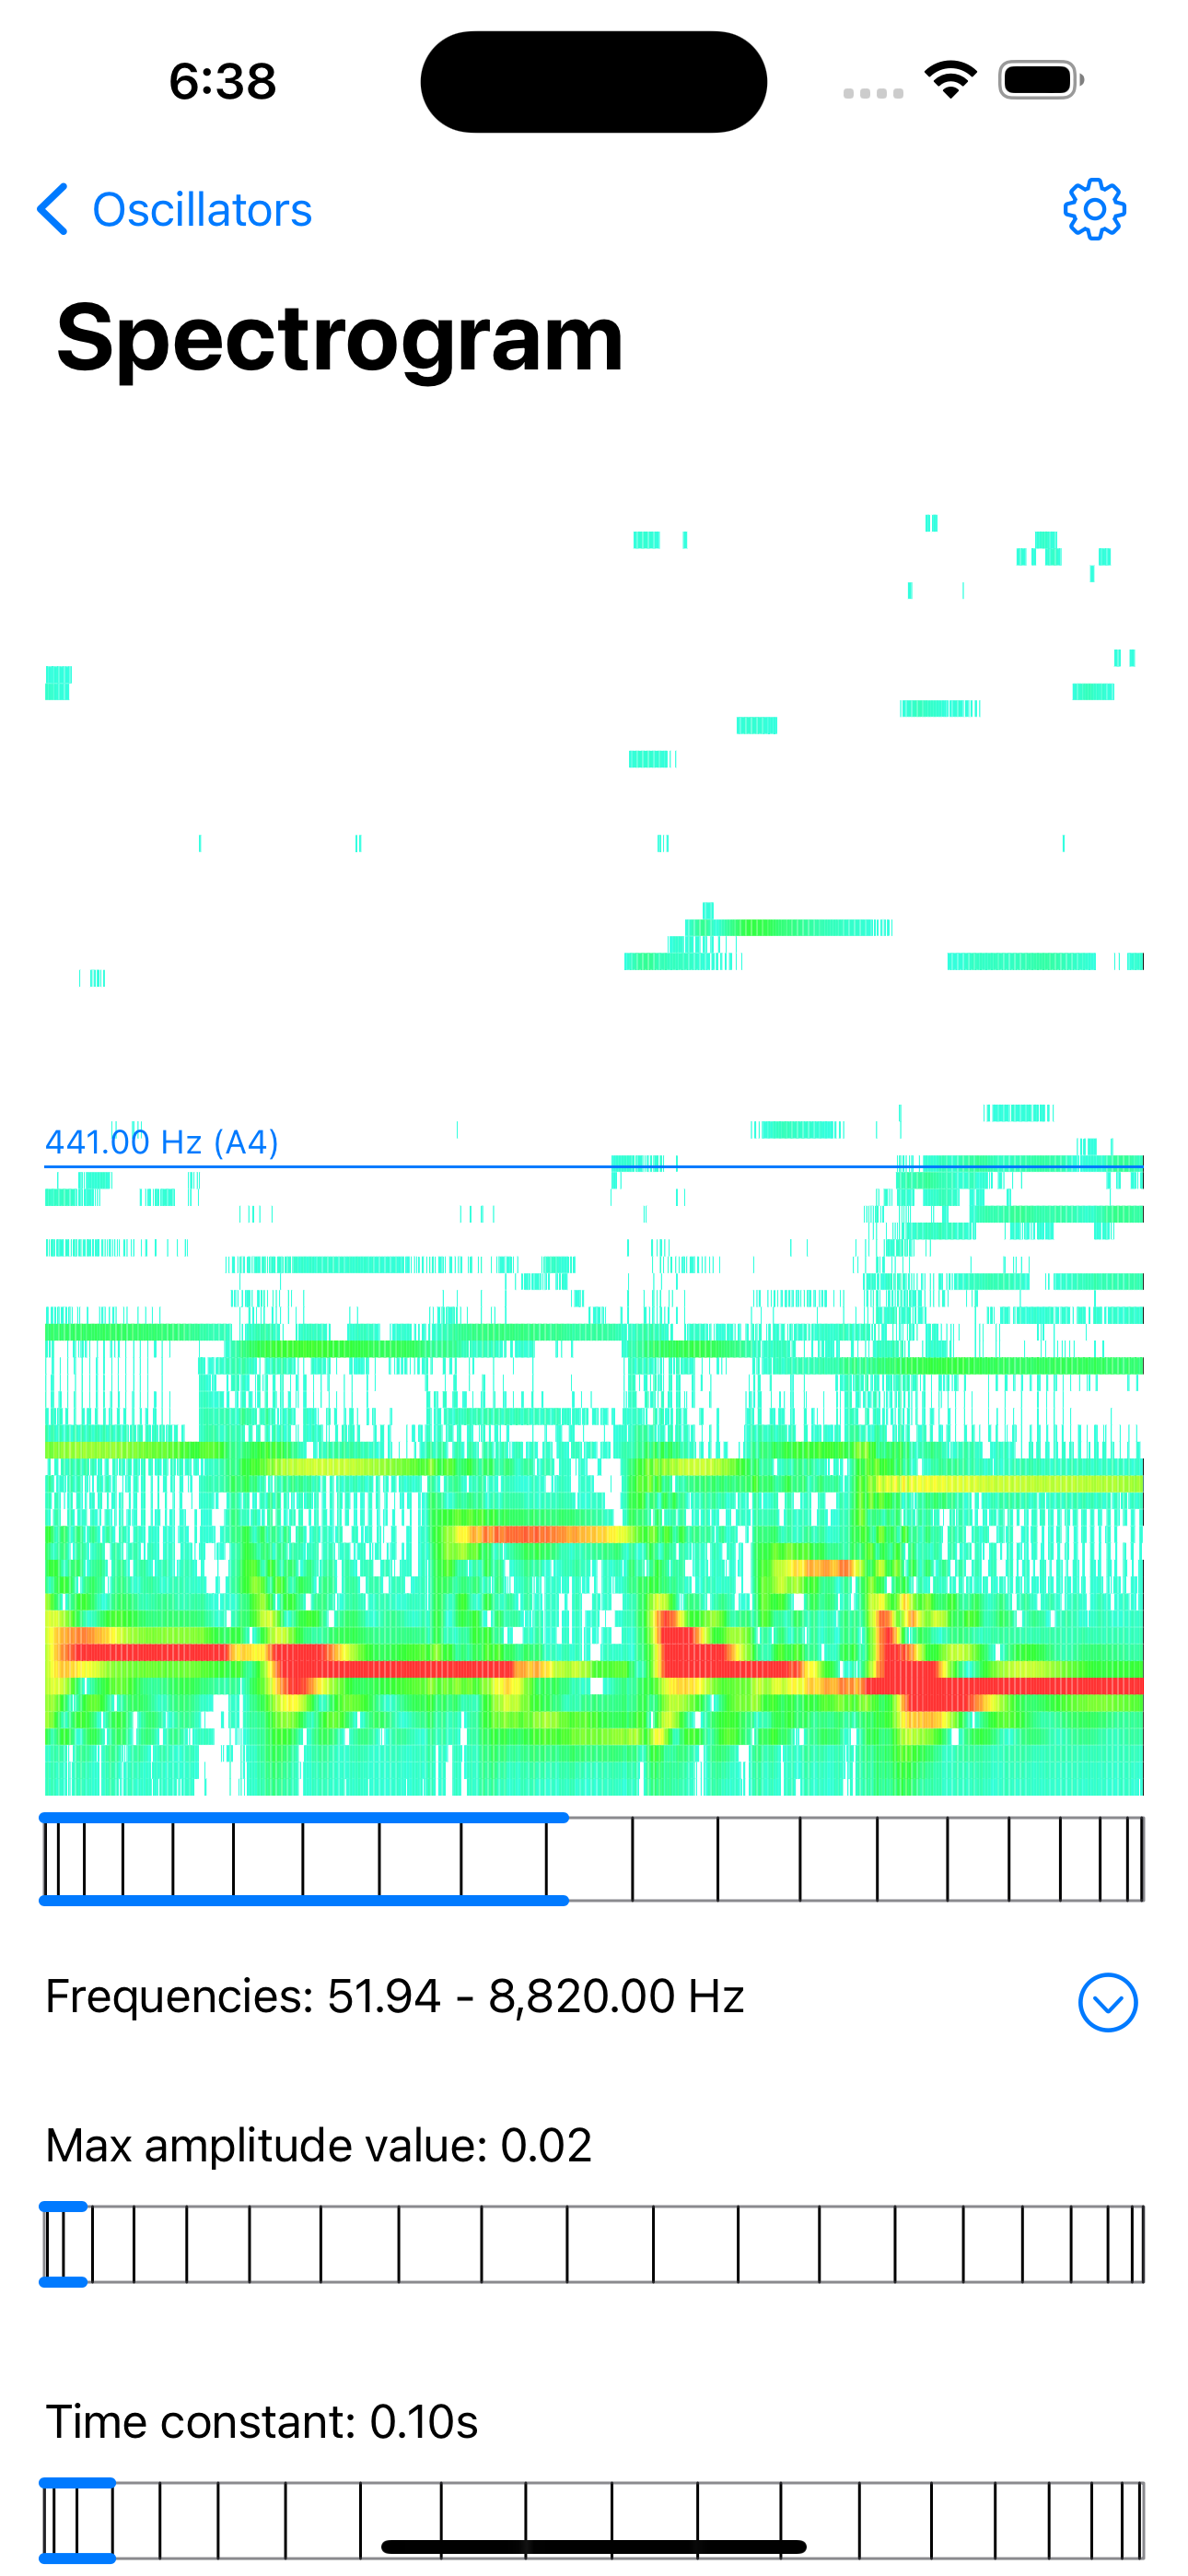
Spectrogram: the spectrogram plots the amplitude levels of the resonators in a resonator bank over time. The resonators in the bank are tuned to natural frequencies based on human auditory perception and organized from lowest to highest frequency (Gradient Frequency bank). In the plot, frequencies are represented on the vertical axis, lowest frequency at the bottom, highest at the top. Time flows on the horizontal axis, to the left of the screen. Amplitude levels are color mapped, low to high, from green through yellow to red.
Dynamics Analysis
By using truly dynamic resonator models, we can investigate the effects of dynamics parameters on the analysis. For dynamics analysis, all resonators in the bank are tuned to the same frequency, and each resonator has a different time constant, set as a function of the frequency. The time constant regulates the dynamics of the low-pass filter through which individual contributions from each audio sample are accumulated over time in the resonators. The shorter the time constant the more reactive the resonator.
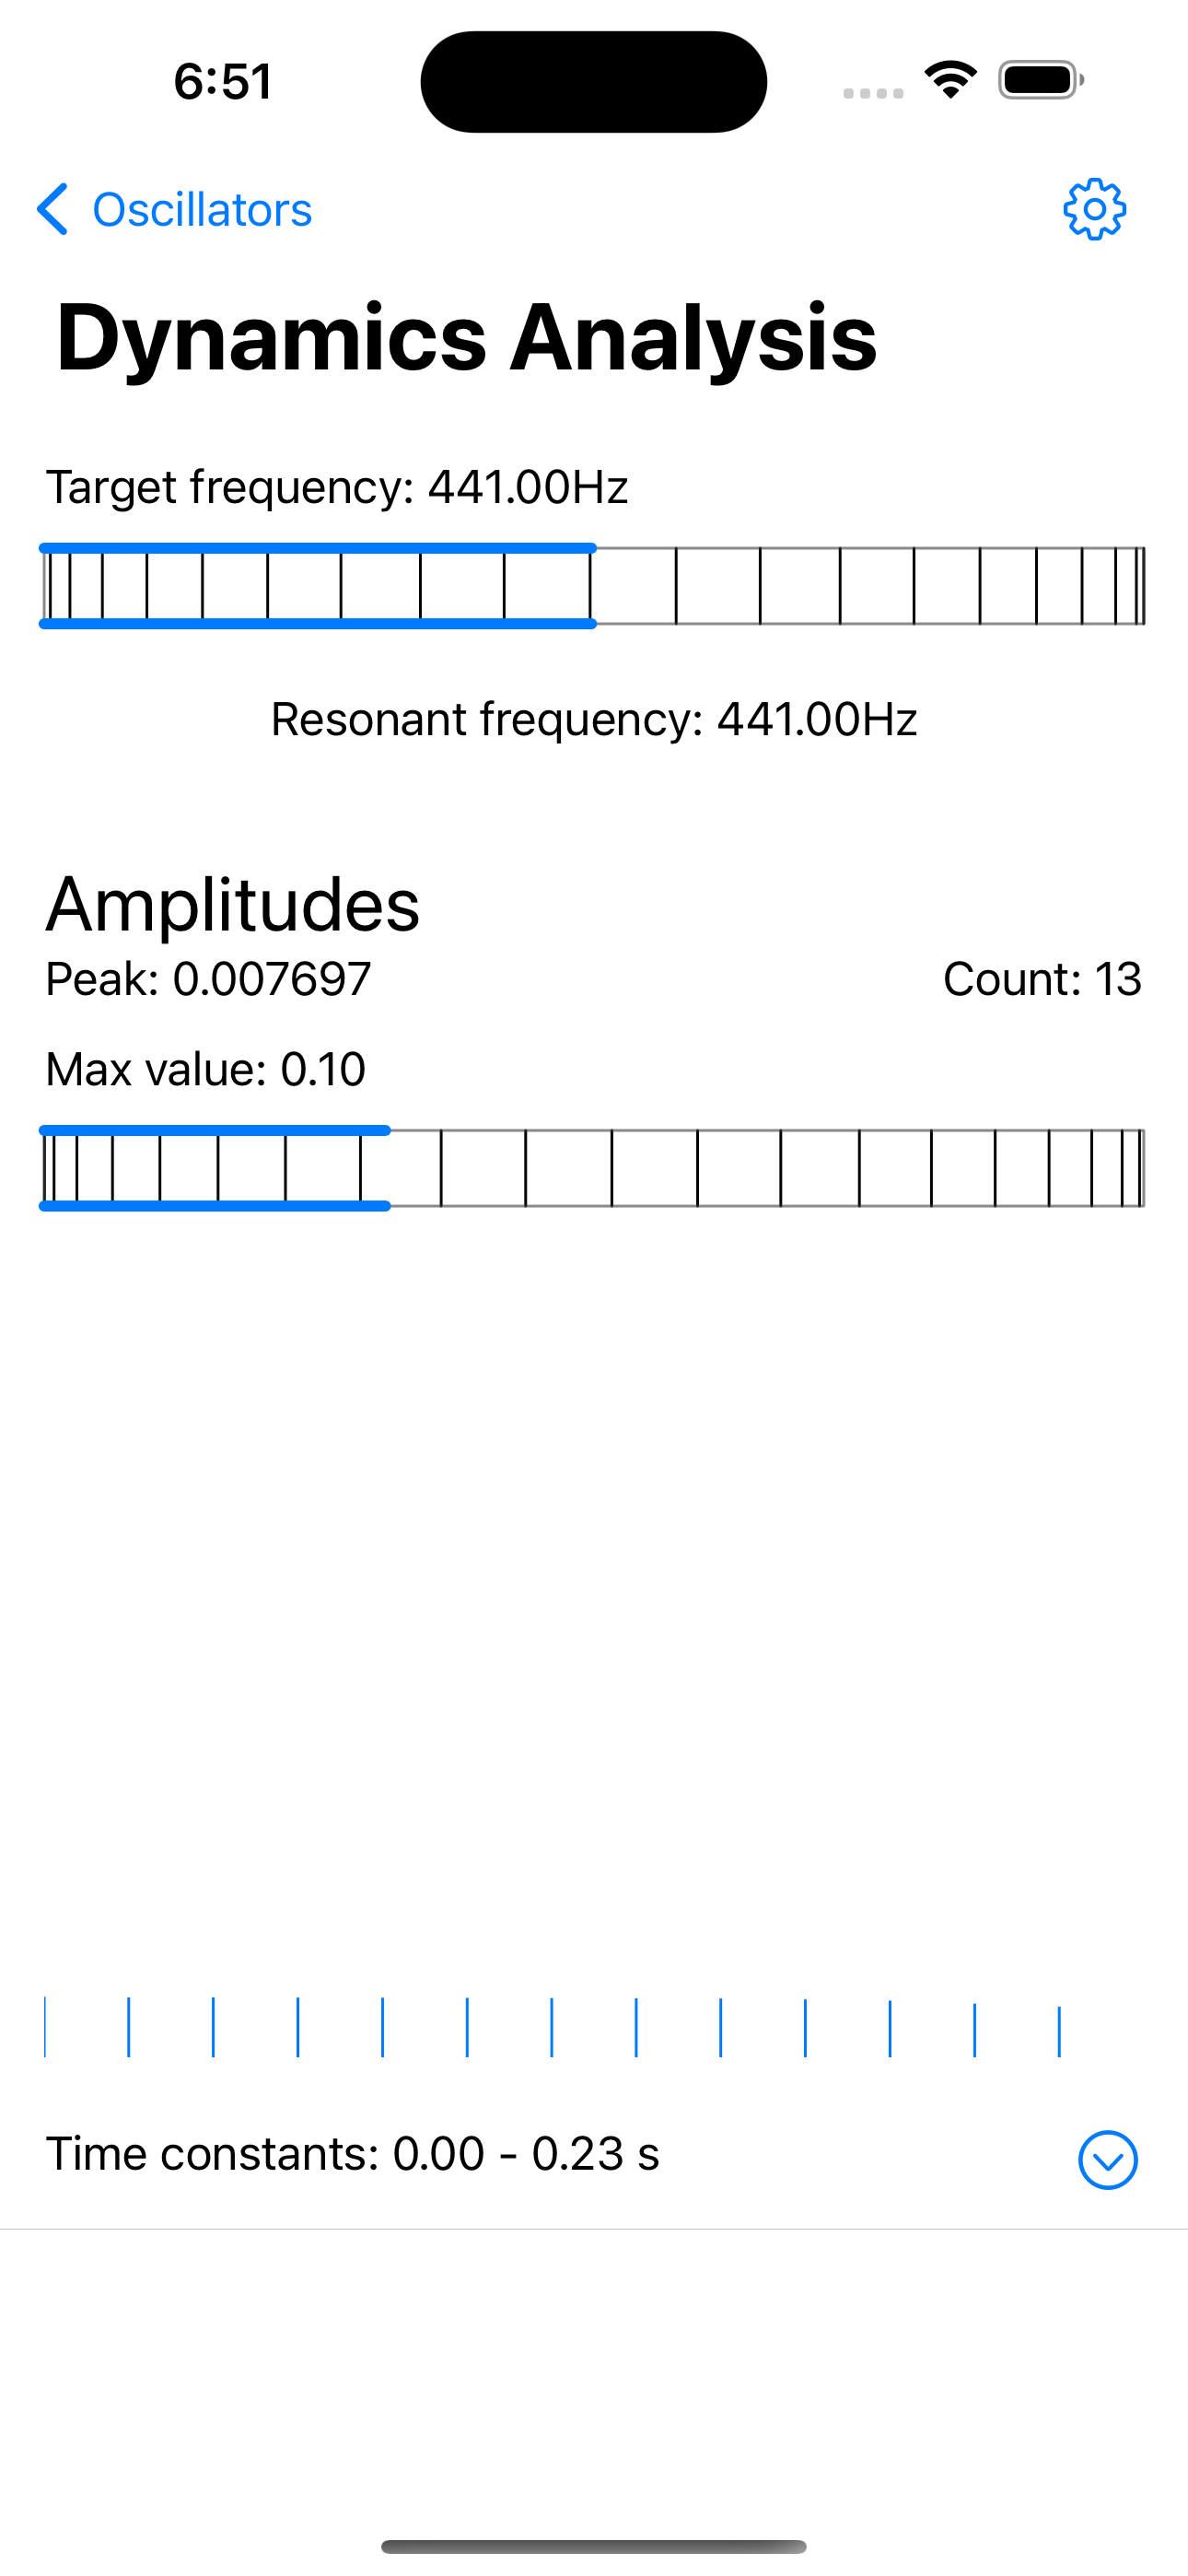
The amplitude graph plots the current amplitude of each resonator in the bank. The resonators are ordered by increasing time constant value from left to right on the horizontal axis.
Demonstrations
All this is very preliminary, and I have many more explorations, experiments and applications in mind… which I will try and do as time and resources permit.
In the meantime, keep checking the Oscillators playlist on my YouTube channel for fun experiments with the Oscillators app.